Q&A 35 How do you visualize trends across an ordered variable using a line plot?
35.1 Explanation
A line plot connects data points to show trends over a continuous variable — commonly time, index, or ordered categories.
- Useful when data is sequential or ordered
- Highlights rising/falling trends and fluctuations
- Requires x-axis to represent a logical order
In the case of the iris dataset, we can simulate a sorted index to demonstrate this.
35.2 Python Code
import pandas as pd
import seaborn as sns
import matplotlib.pyplot as plt
df = pd.read_csv("data/iris.csv")
df_sorted = df.sort_values("sepal_length").reset_index()
# Line plot showing sepal width trend over sorted sepal length
plt.figure(figsize=(6, 4))
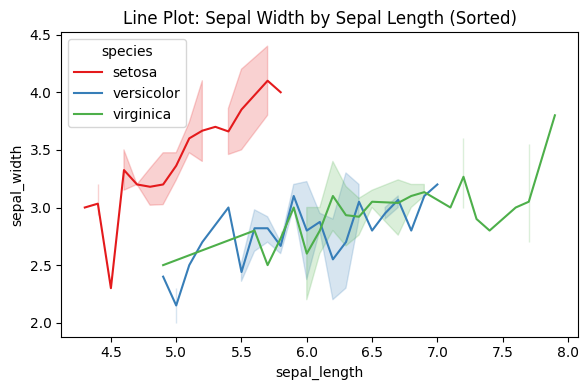
sns.lineplot(data=df_sorted, x="sepal_length", y="sepal_width", hue="species", palette="Set1")
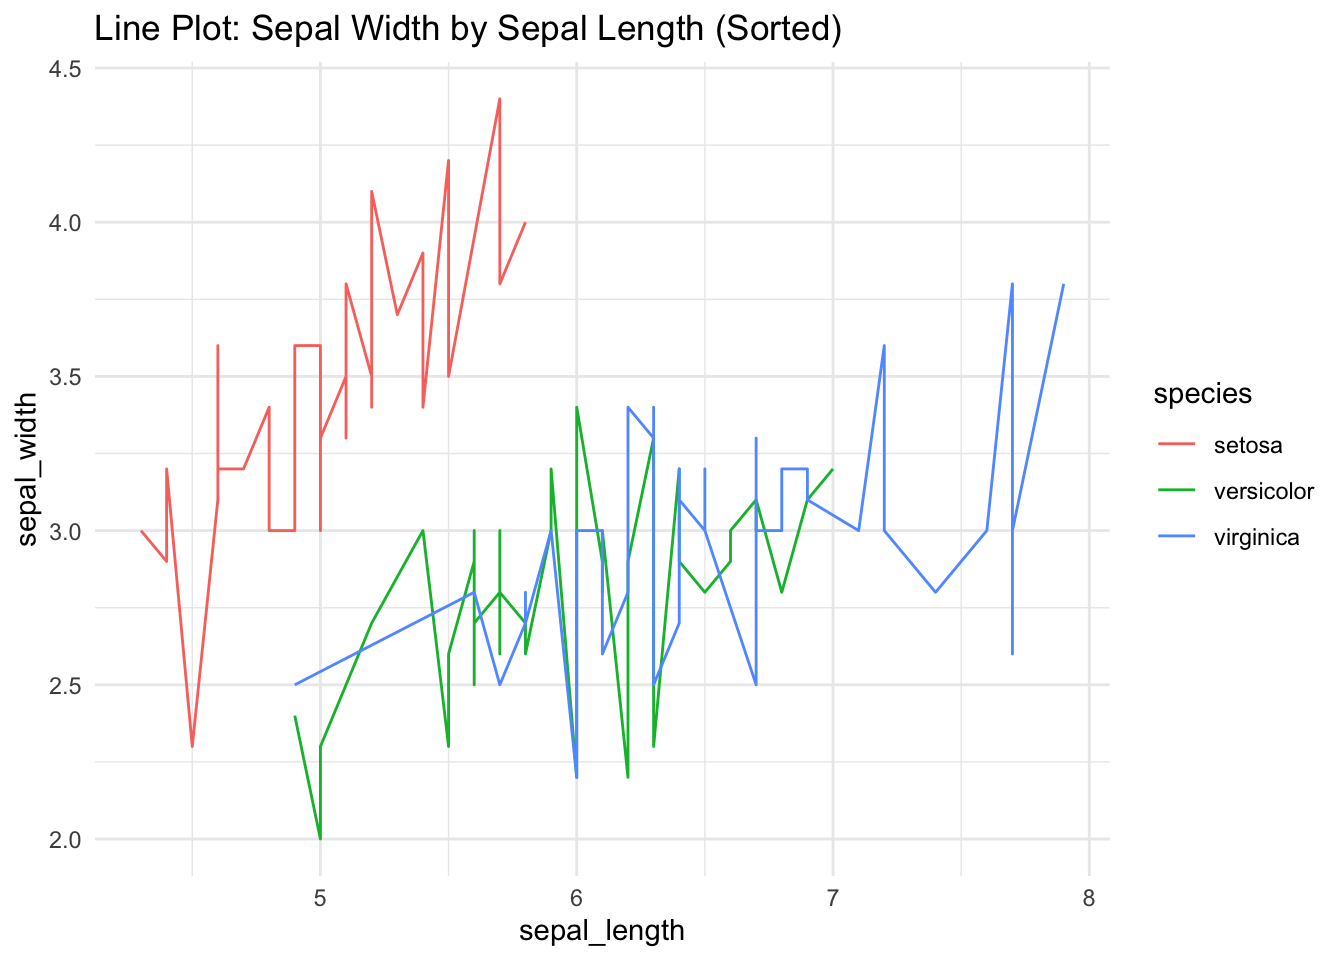
plt.title("Line Plot: Sepal Width by Sepal Length (Sorted)")
plt.tight_layout()
plt.show()