Q&A 45 How do you visualize overlaps using a Venn diagram?
45.1 Explanation
A Venn diagram shows overlaps between 2–3 groups, highlighting shared or unique elements. It’s useful for set-based comparisons such as:
- Group membership
- Feature presence
- Gene or item overlap between datasets
These diagrams help explore: - What’s unique to each group - What’s common across groups
Use cases include marketing segments, gene lists, or survey results.
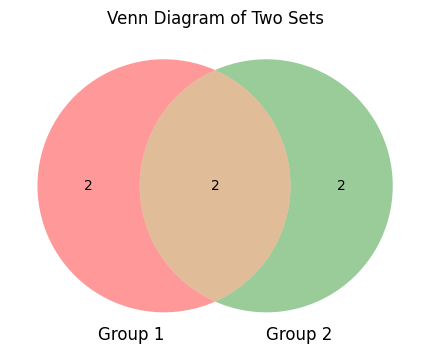
45.2 Python Code
from matplotlib_venn import venn2, venn3
import matplotlib.pyplot as plt

# Example with 2 sets
set1 = set(["A", "B", "C", "D"])
set2 = set(["C", "D", "E", "F"])

plt.figure(figsize=(6, 4))
venn2([set1, set2], set_labels=("Group 1", "Group 2"))
plt.title("Venn Diagram of Two Sets")
plt.show()
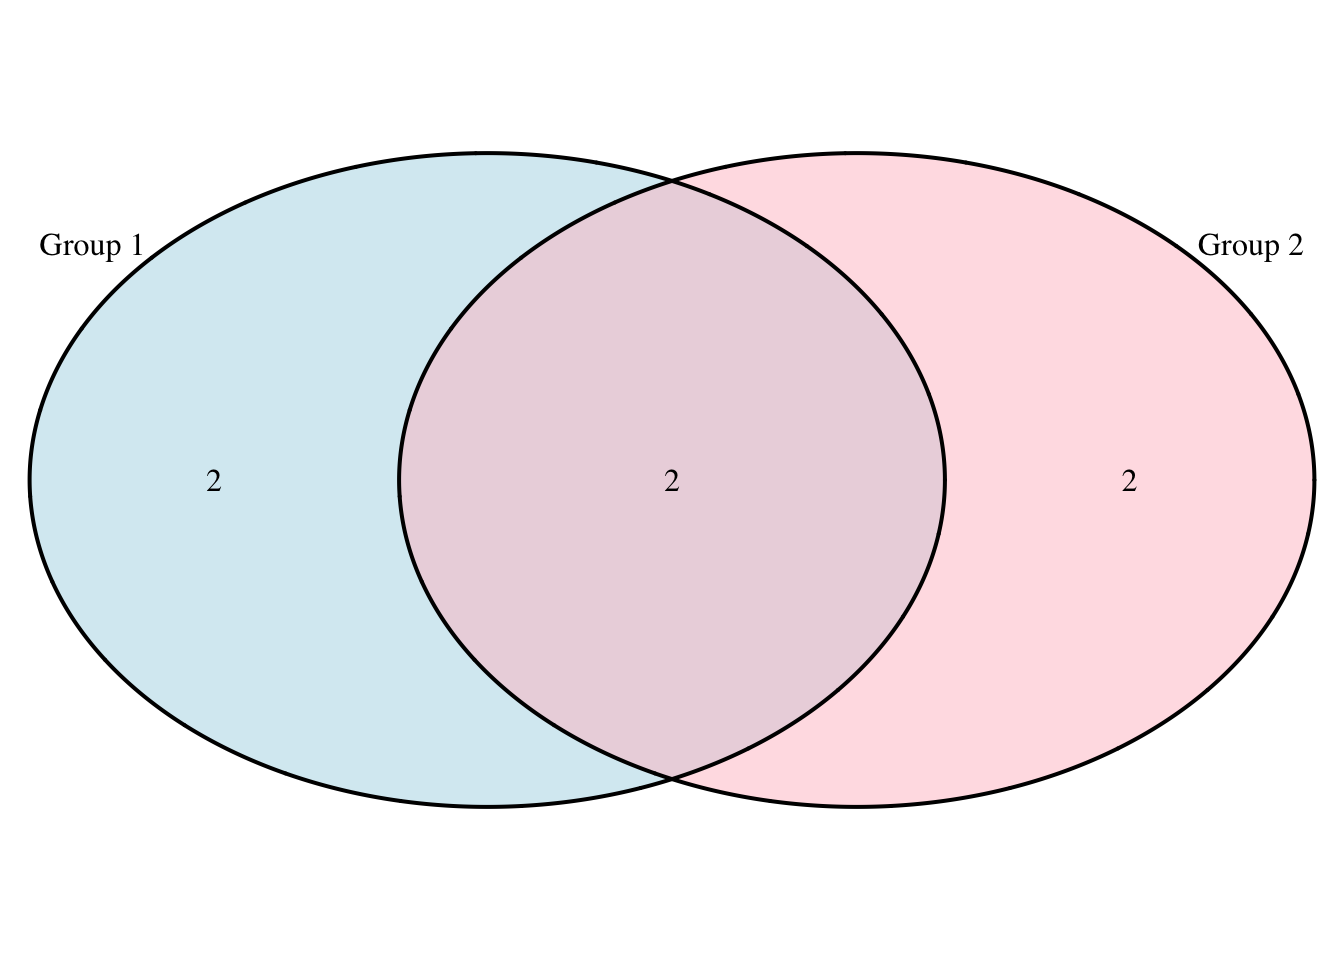
45.3 R Code
# Install package if needed
# install.packages("VennDiagram")

library(VennDiagram)

# Create Venn diagram for two sets
venn.plot <- draw.pairwise.venn(
  area1 = 4, area2 = 4, cross.area = 2,
  category = c("Group 1", "Group 2"),
  fill = c("lightblue", "pink"),
  ind = FALSE
)

grid.draw(venn.plot)