Q&A 44 How do you create a static treemap in Python?
44.1 Explanation
While plotly.express allows you to create beautiful interactive treemaps, those won’t render in static reports like PDF or non-browser Bookdown formats.
To generate static treemaps for reports, use the squarify library instead, which works with matplotlib.
44.2 Python Code
import pandas as pd
import matplotlib.pyplot as plt
import squarify
# Sample data
data = pd.DataFrame({
"label": ["Setosa Short", "Setosa Long", "Versicolor Short", "Versicolor Long", "Virginica Short", "Virginica Long"],
"value": [20, 30, 25, 25, 15, 35]
})
# Generate colors
colors = plt.cm.viridis_r([i / float(len(data)) for i in range(len(data))])
# Create static treemap
plt.figure(figsize=(10, 6))
squarify.plot(sizes=data["value"], label=data["label"], color=colors, alpha=0.8)
plt.axis("off")
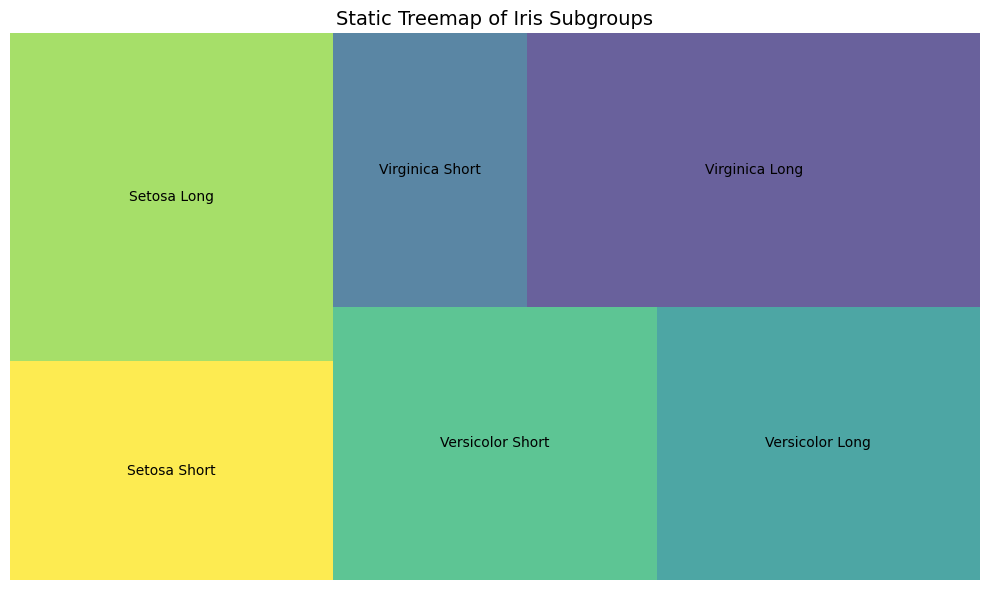
plt.title("Static Treemap of Iris Subgroups", fontsize=14)
plt.tight_layout()
plt.savefig("images/static_treemap_iris.png")
plt.show()
44.3 R Code
# Load libraries
library(treemap)

# Sample data
data <- data.frame(
  group = c("Setosa", "Setosa", "Versicolor", "Versicolor", "Virginica", "Virginica"),
  subgroup = c("Short", "Long", "Short", "Long", "Short", "Long"),
  value = c(20, 30, 25, 25, 15, 35)
)

# Create treemap
treemap(
  data,
  index = c("group", "subgroup"),
  vSize = "value",
  type = "index",
  title = "Treemap of Iris Subgroups"
)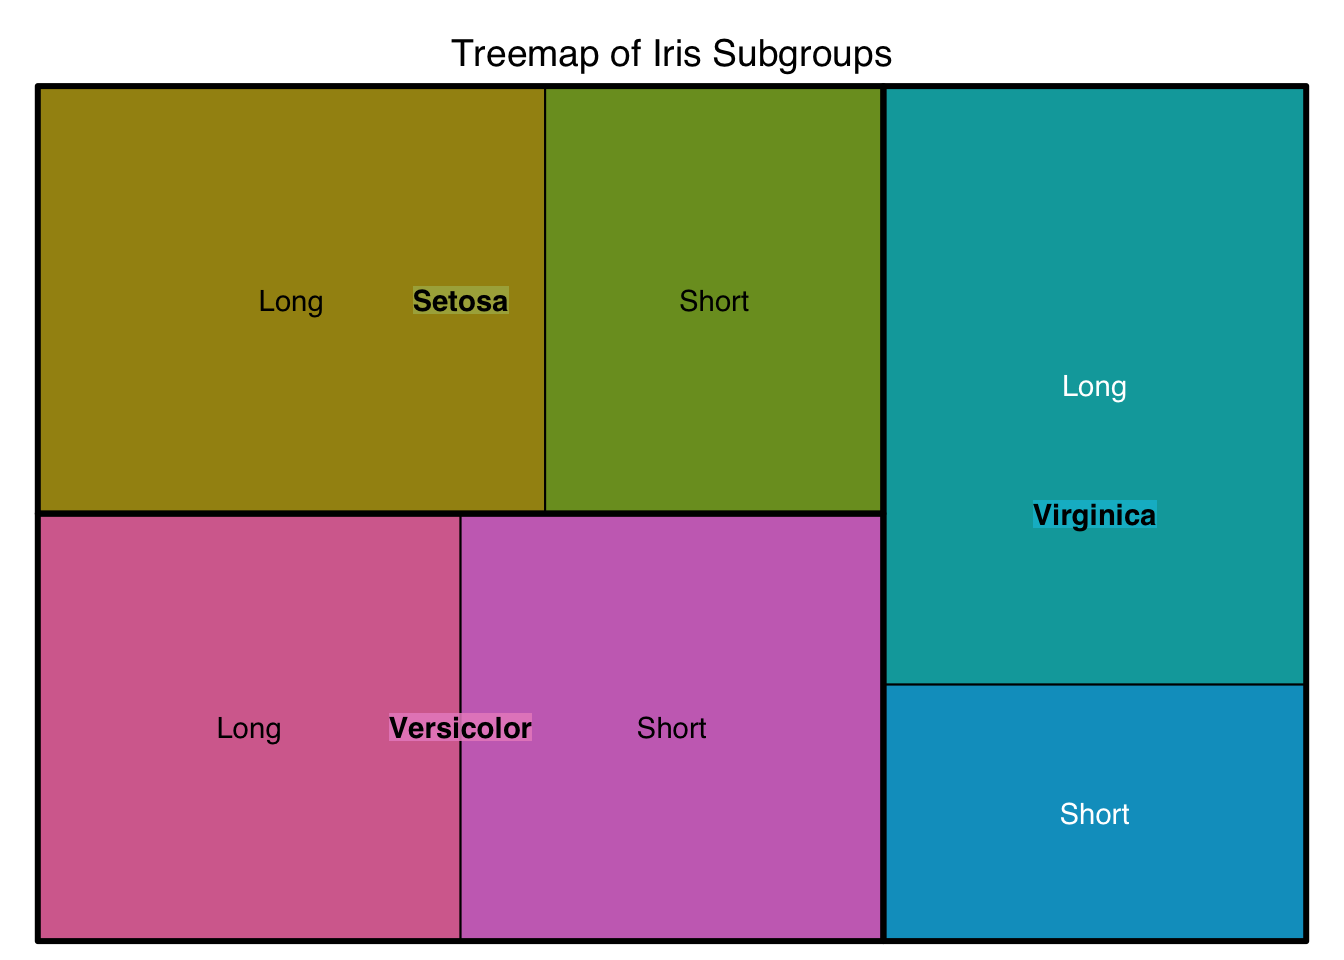
📊 Treemap Interpretation
This treemap visualizes the distribution of sepal length categories (Short vs Long) within each iris species.
- The area of each rectangle represents the count of samples in that subgroup.
- Each color block corresponds to a species, and sub-rectangles show proportions within it.
For example: - Setosa has a higher number of long sepals than short ones. - Virginica shows a similar pattern but with more total samples in the Long group. - The visual layout makes it easy to compare both within-group composition and between-group scale.