Q&A 42 How do you create a donut chart to show part-to-whole proportions?
42.1 Explanation
A donut chart is a variation of the pie chart with a central hole. It helps communicate part-to-whole relationships in a slightly more readable way than standard pie charts.
- Works best when visualizing a single categorical variable with a few categories.
- The hole in the center draws focus and allows space for labeling.
- Use labels, percentages, or center annotations to enhance clarity.
While not ideal for precision comparison, donut charts are useful for quick visual summaries.
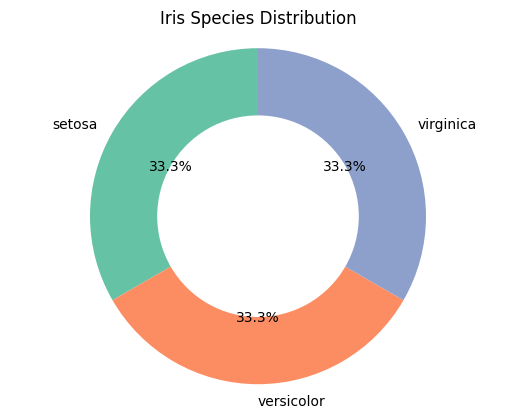
42.2 Python Code
import pandas as pd
import matplotlib.pyplot as plt

# Example categorical data
df = pd.read_csv("data/iris.csv")
species_counts = df["species"].value_counts()

# Donut chart
colors = plt.cm.Set2.colors
plt.pie(species_counts, labels=species_counts.index, colors=colors,
        autopct='%1.1f%%', startangle=90, wedgeprops={'width': 0.4})

plt.title("Iris Species Distribution")
plt.axis("equal")
plt.show()
42.3 R Code
library(ggplot2)
library(dplyr)

# Load data
df <- readr::read_csv("data/iris.csv")

# Count species
df_counts <- df %>%
  count(species) %>%
  mutate(prop = n / sum(n),
         ypos = cumsum(prop) - 0.5 * prop)

# Donut chart
ggplot(df_counts, aes(x = 2, y = prop, fill = species)) +
  geom_bar(stat = "identity", width = 1, color = "white") +
  coord_polar(theta = "y") +
  xlim(0.5, 2.5) +
  theme_void() +
  geom_text(aes(y = ypos, label = scales::percent(prop)), color = "white") +
  ggtitle("Iris Species Distribution (Donut Chart)") +
  theme(legend.position = "right")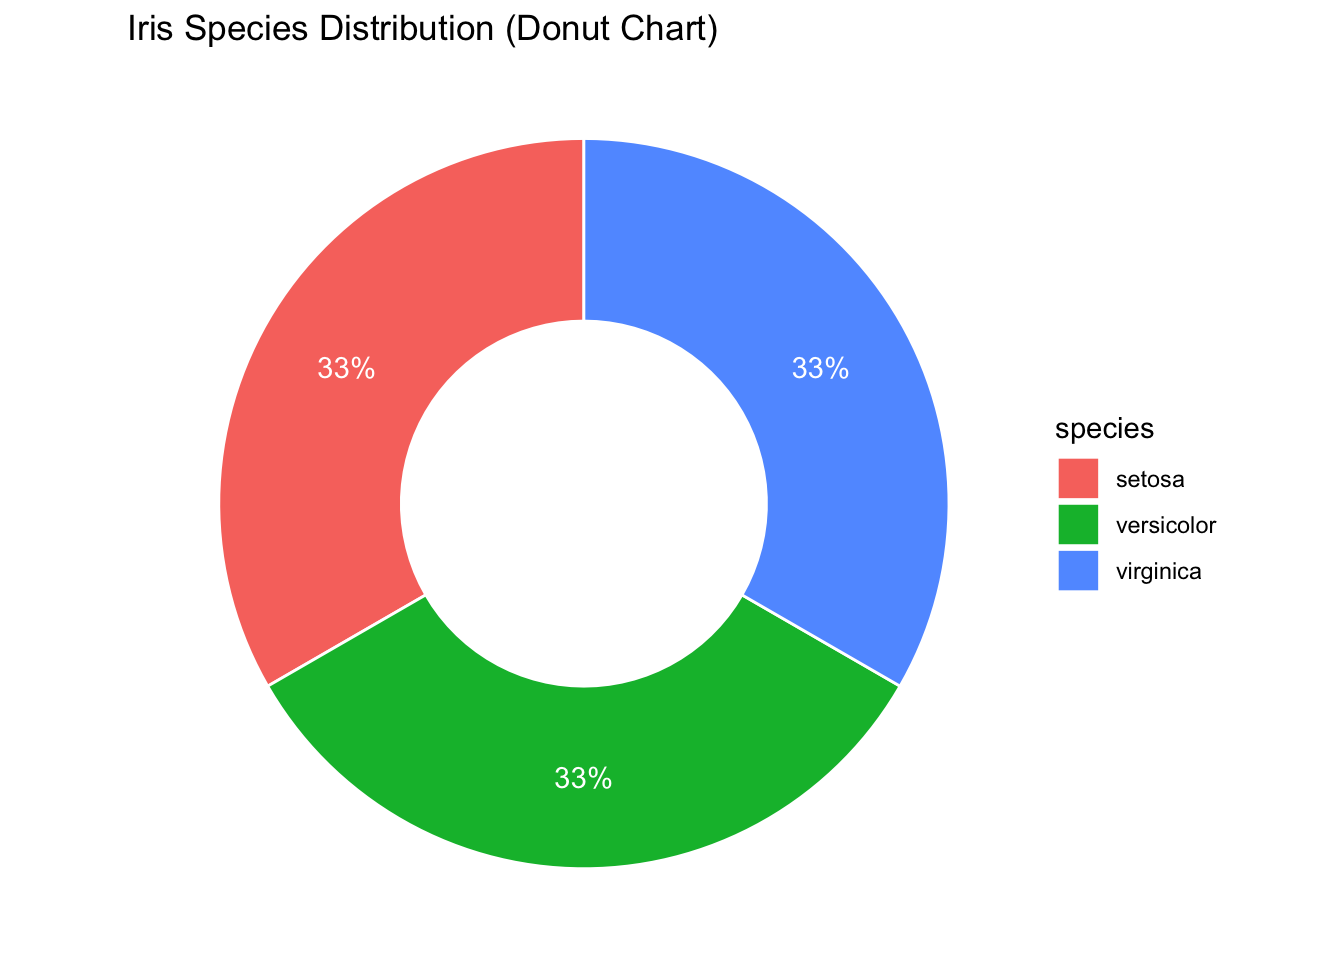
⚠️ Note on Pie and Donut Charts
While pie charts and donut charts can be visually appealing, they are often discouraged in data science due to several limitations:
- Hard to compare slice sizes accurately
- Easily cluttered with more than ~5 categories
- Misleading when values are close together
Donut charts are a stylistic variation of pie charts — with a central hole — but they inherit the same interpretability issues.
✅ Better alternatives: - Use a bar plot for clearer comparisons
- Consider treemaps for hierarchical part-to-whole relationships✔️ Use pie/donut charts only when: - You have a small number of categories (ideally ≤ 4)
- The message is focused on part-to-whole (not precise comparison)