Q&A 24 How do you use a histogram to visualize numerical distributions?
24.1 Explanation
A histogram divides numerical data into intervals (bins) and shows how many observations fall into each bin. It helps reveal the shape of the distribution — such as whether it’s:
- Symmetric, skewed, or bimodal
- Uniform, peaked, or flat
Histograms are useful for detecting: - Data spread and central tendency - Potential outliers or gaps - Whether transformation might be needed
24.2 Python Code
import pandas as pd
import matplotlib.pyplot as plt
import seaborn as sns

# Load dataset
df = pd.read_csv("data/iris.csv")

# Plot histogram for sepal length
plt.figure(figsize=(6, 4))
sns.histplot(df["sepal_length"], bins=10, kde=False, color="steelblue")
plt.title("Histogram of Sepal Length")
plt.xlabel("Sepal Length (cm)")
plt.ylabel("Frequency")
plt.tight_layout()
plt.show()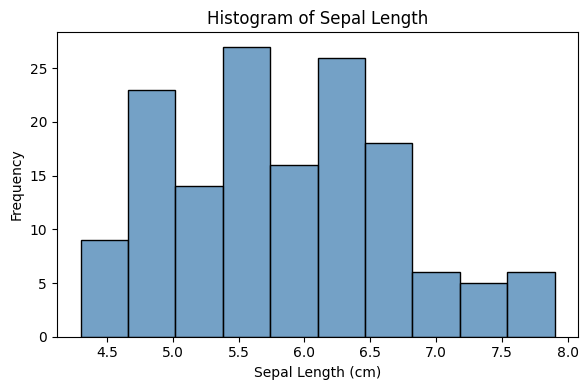
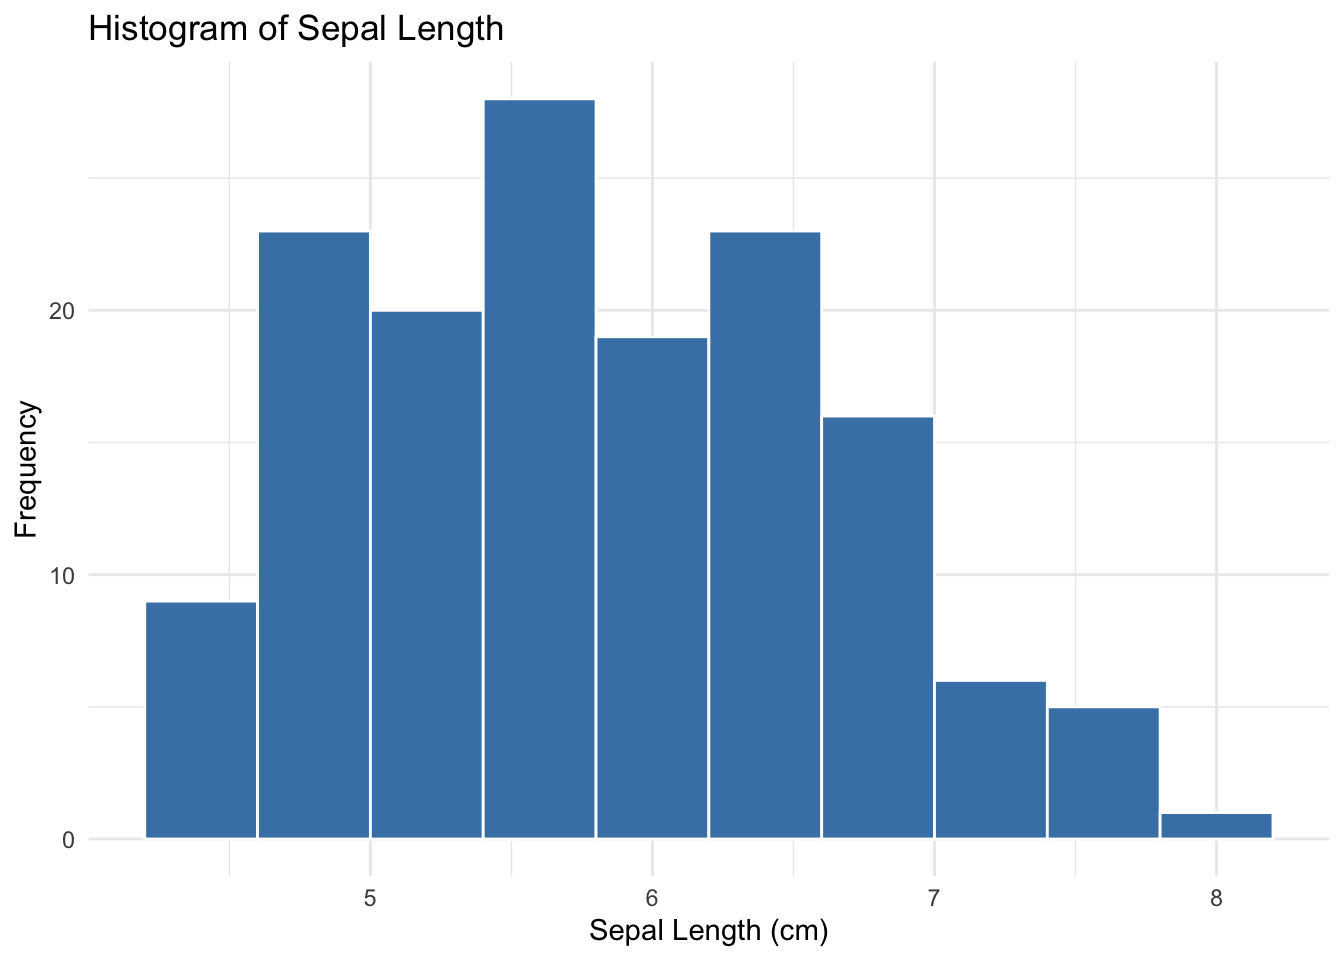
24.3 R Code
library(ggplot2)
library(readr)

# Load dataset
df <- read_csv("data/iris.csv", show_col_types = FALSE)

# Plot histogram
ggplot(df, aes(x = sepal_length)) +
  geom_histogram(bins = 10, fill = "steelblue", color = "white") +
  labs(title = "Histogram of Sepal Length",
       x = "Sepal Length (cm)", y = "Frequency") +
  theme_minimal()