Q&A 31 How do you visualize individual observations using a swarm plot?
31.1 Explanation
A swarm plot displays all individual data points across a categorical axis while avoiding overlaps. It is a powerful way to show the distribution and clustering of observations within each group.
- Unlike strip plots, swarm plots use a smart layout algorithm to minimize overlapping.
- Best suited for small to medium datasets where every point matters.
- Commonly used to complement boxplots or violin plots.
They help:
- Visualize the spread of values within each group
- Detect patterns, outliers, or group separation
31.2 Python Code
import pandas as pd
import seaborn as sns
import matplotlib.pyplot as plt

# Load iris dataset
df = pd.read_csv("data/iris.csv")
df["species"] = df["species"].astype("category")  # Ensure species is categorical

# Swarm plot
plt.figure(figsize=(6, 4))
sns.swarmplot(data=df, x="species", y="sepal_length", hue="species",
              palette="Set2", dodge=False, legend=False)

# Customize plot
plt.title("Swarm Plot of Sepal Length by Species")
plt.xlabel("Species")
plt.ylabel("Sepal Length")
plt.tight_layout()
plt.show()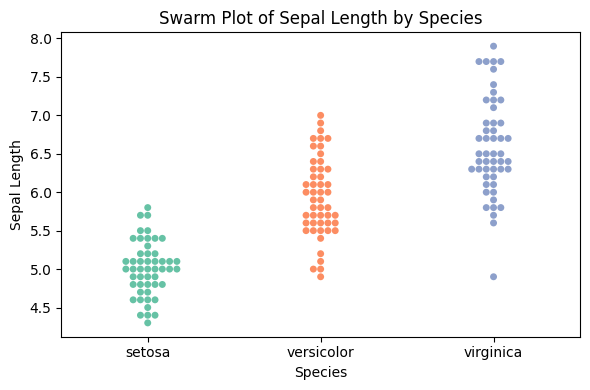
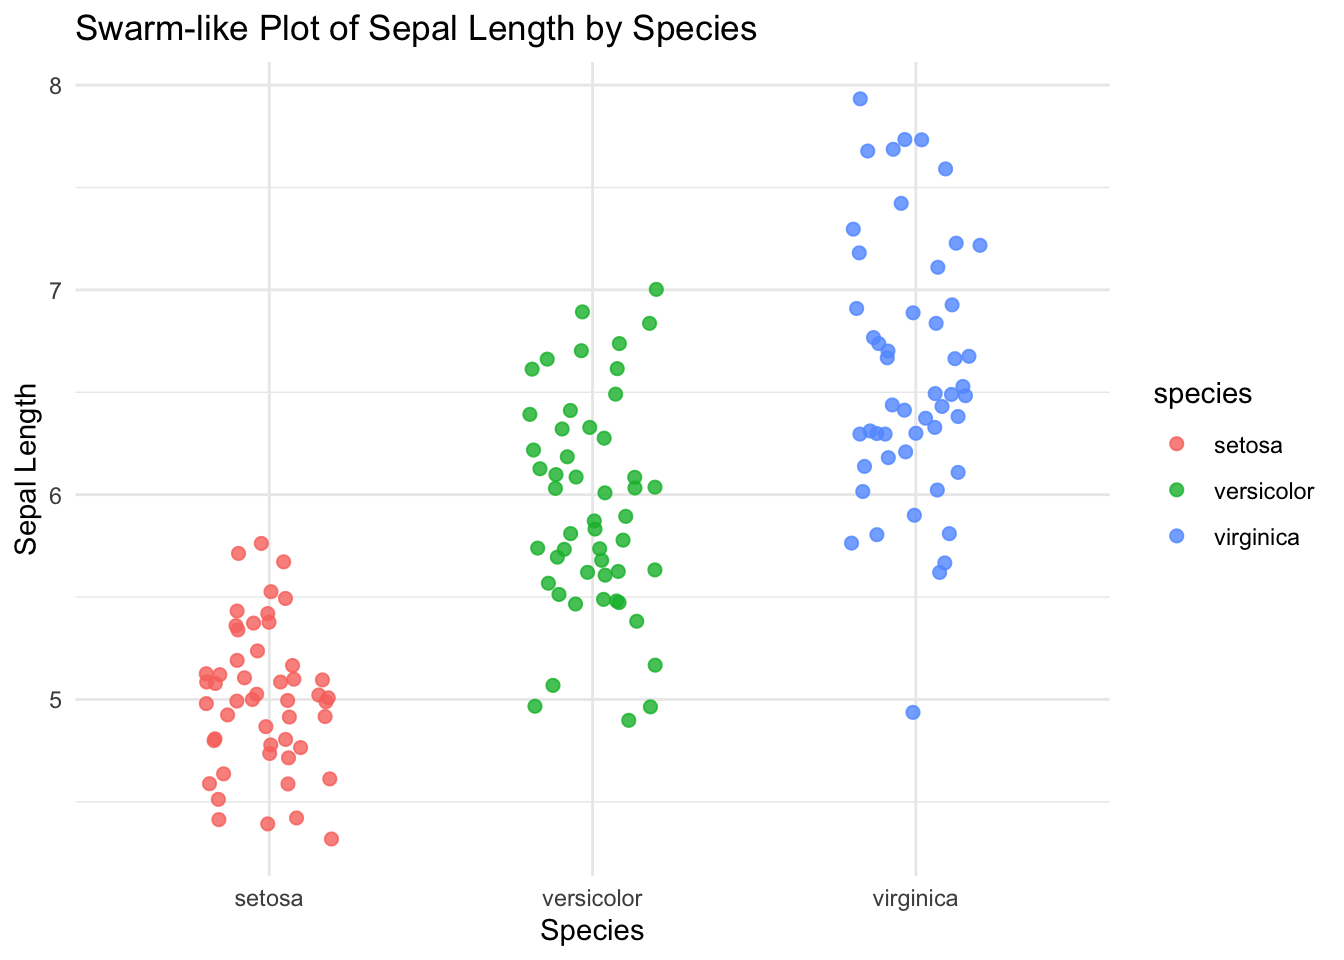
31.3 R Code
library(ggplot2)
library(readr)

# Load iris dataset
df <- read_csv("data/iris.csv")
df$species <- as.factor(df$species)

# Swarm-like plot using jitter
ggplot(df, aes(x = species, y = sepal_length, color = species)) +
  geom_jitter(width = 0.2, size = 2, alpha = 0.8) +
  labs(title = "Swarm-like Plot of Sepal Length by Species",
       x = "Species", y = "Sepal Length") +
  theme_minimal()